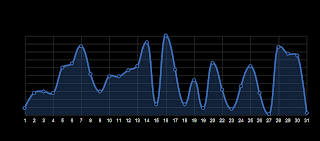
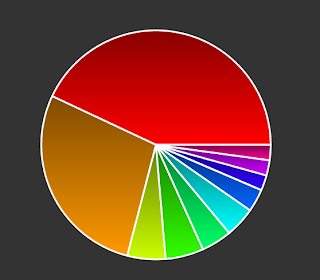
It adheres to the Scalable Vector Graphics (SVG)specifications and the Vector Markup Language (VML) for all its graphics. As it adheres to these specifications, every graphical object acts like a DOM object. We can associate event handlers to them just like in any JavaScript function. Also, these objects remain unaltered on zoom-in or zoom-out.

The steps to create a visual on a web page using Raphael are:
- Download Raphael from this link.
- Include it in your HTML web page.
- Create a canvas to draw the objects on. This canvas is called as 'paper'. All the items drawn will be with reference to this canvas object. This paper is created using the Raphael() object as follows:
var paper = new Raphael(element, width, height);
- Once the canvas is created, any desired object can be created on it using the many options provided by Raphael. Example:
var rectangle = paper.rect(400,400,250,200)
//creates a rectangle at co-ordinate (400,400) of len=250, width=200
var ellipse = paper.rect(350,350,100,45)
//creates an ellipse at co-ordinate(350,350) of radius x=100 and y=45
- The documentation of Raphael lists the objects that can be created, the associated attributes with them and the animations that are supported. You can also write your own functions in Raphael and use it as a plug-in. More details about writing customized functions to a canvas or an element can be found here.
 Raphael is supported on Firefox 3.0+ and later, Chrome 5.0+, IE 6.0+, Safari 3.0+.
References:
0 comments:
Post a Comment