A new source.
Saturday, July 2, 2011

Tool: Data Visualization Platform, Weave, Now Open Source
By some authors of the latest viz textbook.
Data Visualization Platform, Weave, Now Open Source

Visualization: national geo income x population
Is red bigger than blue, or smaller? Heat maps have problems. 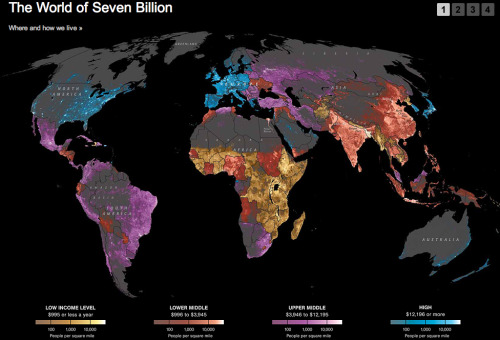
covestor:Here’s an amazing new graphic from National...

Event: Day 1 at the Eyeo Festival
Processing in JavaScript. Nyt graphics editor.
Day 1 at the Eyeo Festival: Converge to Inspire


Event: Eyeo -- the Practice of Digital Information & Art
Lots of big names here, especially on the design side.

Day 3 at Eyeo: the Practice of Digital Information & Art
Friday, July 1, 2011
Viz: The Traditional Family Gives Way to an Array of Configurations
Surprising that cities are the home of traditional family.
The Traditional Family Gives Way to an Array of Configurations ...
Viz: A $176 Billion Gap for Public Pensions
Nc doing better than I thought.
A $176 Billion Gap for Public Pensions - Graphic - NYTimes.com
Viz: American Forces in Afghanistan and Iraq
Striking shift from Iraq to Afghanistan under Obama.
American Forces in Afghanistan and Iraq - Interactive Graphic ...
Viz: Sweet Spots, But Not Many
Natural gas not as easy to produce as we think.
Sweet Spots, But Not Many - Graphic - NYTimes.com
Subscribe to:
Posts (Atom)