Friday, June 1, 2012

Find: Qt 5 makes JavaScript a first-class citizen for app development


First look: Qt 5 makes JavaScript a first-class citizen for app development

The Qt development toolkit is undergoing a major overhaul. The developers behind the project announced the availability of the Qt 5 alpha release this week. It's a key milestone on the path to the official launch of Qt 5, expected to occur later this year.


Qt is an open source toolkit designed to support cross-platform desktop and mobile application development. It provides libraries, user interface controls, and other components. Qt was originally created by Trolltech, a Norwegian software company that Nokia acquired in 2008. Nokia subsequently relicensed Qt under more permissive terms and transitioned the toolkit to a community-driven open governance model.


The rise of Qt Quick


The update to Qt 5 will bring many significant technical and philosophical changes to the toolkit. The developers aim to transition the focus of Qt away from the traditional widget system (based on QWidget C++ classes) in favor of Qt Quick, a declarative scripting framework for building rich interfaces. This change will gradually shift Qt application developers away from the toolkit's C++ roots.


Read more on Ars Technica…


Wednesday, May 30, 2012

Find: US government to make data available through apis

Soon please. 

Open government reboot focuses on APIs instead of data


Issued by the Office of Management and Budget, the Digital Government Strategy is the basis of a new White House directive to expose "high-value" Federal data through Web APIs


Have you ever wanted a mobile app that ties your location to crime statistics, government environmental and health data, and weather and solar flare data to calculate the hourly probability of a zombie apocalypse?  While that may not be exactly what the White House has in mind, it’s the sort of mobile mash-up that a new Federal IT policy could make a lot less difficult to create. The Obama administration has added another twist on “open government”—open, as in open API.


On May 23, the White House issued a directive that requires all agencies to establish programming interfaces for internal and external developers to use, and make “applicable Government information open and machine-readable by default.” As part of an effort to push government toward a cloud-computing future, the White House is encouraging agencies to make their data more developer friendly, and to create a shared platform for providing mobile access to data for both citizens and government employees. And they have 12 months to start delivering.


The goal of the new policy, called the Digital Government Strategy, is to jump start the government’s three-year old open data initiative, draw more private developer interest, and encourage the development of mobile applications that connect citizens and government employees more effectively with data that has previously been public, but nearly inaccessible.

Tool: Making idiot-proof infographics with Infogr.am

Not for developers, but nice for end users. 

Making idiot-proof infographics with Infogr.am


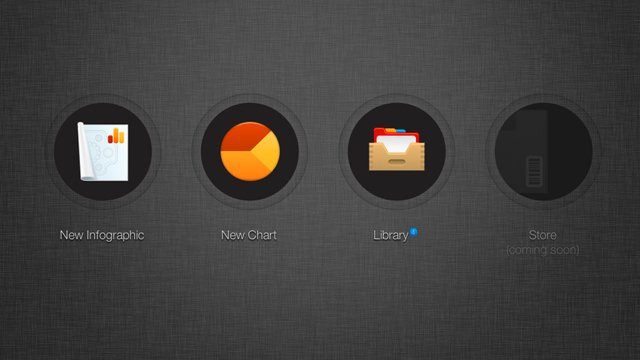
Enlarge / Infogr.am's splash page lets you choose between creating a new design, or accessing previously stored works.


Let's say you want to compare the airspeed velocity of various unladen swallows. You could put that data into a spreadsheet, or present it using a graph. Chances are you'll pick the latter.


The question is, how do you create a graph that not only looks nice, but presents said data in a coherent, easy to understand way? You could go the traditional route, and make something basic in Microsoft Office or your productivity suite of choice. Or, if you have a bit more skill, you could opt for the flexibility of Adobe Illustrator instead. But perhaps you have neither software nor skill, and just want to make a simple graph or chart.


Infogr.am takes the same approach that Tumblr took to blogging, by turning the otherwise daunting task of creating great infographics into a process that's dead-simple. You bring the raw data to Infogr.am, and the site's online tool can help you turn that data into a nice looking chart or full-blown infographic in minutes.  It's really that simple—assuming you have a Facebook or Twitter account required to login—though, at times, to a fault.