Saturday, April 7, 2012
Spotted: A Space-Filling Visualization Technique for Multivariate Small-World Graphs
Data: CPU DB: Recording Microprocessor History
Find: maps.stamen.com is live
maps.stamen.com is live
maps.stamen.com, the second installment of the City Tracking project funded by the Knight News Challenge, is live. These unique cartographic styles and tiles, based on data from Open Street Map, are available for the entire world, downloadable for use under a under a Creative Commons Attribution 3.0 license, and free.
*takes deep breath*
There are three styles available: toner, terrain, and watercolor:
- Toner is about stripping online cartography down to its absolute essentials. It uses just black and white, describing a baseline that other kinds of data can be layered on. Stripping out any kind of color or image makes it easier to like focus on the interactive nature of online cartography: when do different labels show up for different cities? what should the thickness of freeways be at different zoom levels? and so forth. This project is the one that Nathaniel is hacking on at all hours, and it's great to be seeing Natural Earth data get more tightly integrated into the project over time.
Wednesday, April 4, 2012
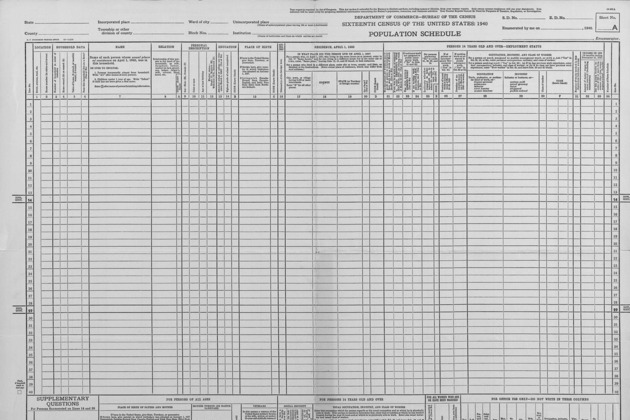
Data: 1940 US Census becoming fully searchable online through volunteer effort

Today the National Archives and Records Administration (NARA) released images of the 1940 Census, and a project is already underway to ensure that the information becomes easily available to anyone who wants to know a bit more about the Great Depression. The NARA has teamed up with leading genealogy groups like Archives.com and FamilySearch.org to create what's being described as a "high quality, searchable database" of the more than one million pages contained in the Census. You can already browse through the Census images, but the process is cumbersome — for instance, you can't search by a person's name, but instead can only browse by location or enumeration district.
But with a team of online volunteers, the 1940 US Census Community...
Find: Ambient Devices CEO Pritesh Gandhi on 'glanceable' data

We're perpetually bombarded with information, 24 hours a day. That's just our connected reality now, and there's very little hope of escaping it. On Valentine's Day, I penned an editorial on how I believe that the secret to distilling this information — the key to preventing humans from collapsing under the ever-growing weight of this data — has been right under our noses for years.
They're called "glanceable" devices, and Massachusetts-based Ambient Devices has been developing them for over a decade. The company spun out of a project at MIT's famed Media Lab with the goal of integrating data points into our lives in a natural, organic way. Ambient's path to building a real business has been an unusual one, producing oddities...
Monday, April 2, 2012
Tool: Chrome 18 arrives with hardware-accelerated Canvas
Version 18 of the Chrome Web browser has rolled out to the stable channel. The new version includes hardware-accelerated rendering for the HTML5 Canvas element on Windows and Mac OS X.
As we have recently reported, standards-based Web technologies provide an increasingly capable platform for game development. The major browser vendors are working to further increase the viability of open standards for browser-based gaming. Offloading Canvas rendering to the GPU helps reduce the CPU load of 2D games and improves performance. The feature has been available in Chrome for quite some time, but it's now finally enabled by default.
Hardware-accelerated Canvas rendering is only available on systems with compatible graphics hardware. You can get some information about what features in Chrome have hardware acceleration enabled on your system by navigating to the "chrome://gpu" URL.
Another key open standard that is relevant for gaming is WebGL, which provides JavaScript APIs for rendering 3D content in the Canvas element. In Chrome 18, Google has introduced a software-based backend for WebGL based on TransGaming's SwiftShader. This will make it possible for users to view WebGL content on computers that don't have compatible graphics hardware. Although it will open up WebGL content to more users, the software-based renderer doesn't offer comparable performance to native hardware-accelerated WebGL.
In addition to these improvements, the Chrome developers have also been working to make various security improvements based on vulnerabilities that were exposed during the Pwnium competition. For more details about the Chrome 18 release, you can refer to the official release announcement. The software is available for download from Google's website.
