Showing posts with label data. Show all posts

Thursday, March 14, 2013

Data: Public Data Website to Launch This Week

Public Data Website to Launch This Week

Data geeks can rejoice as the City of Raleigh makes more public information available through its new website.


This week the City will launch Open Raleigh, a new platform for storing, accessing and visualizing public data. It’s appropriate timing, considering March 10-16 is Sunshine Week, a celebration of open government.


City officials hired Socrata, a company that specializes in open data, to host the site, which will include various forms of public information. The city will spend $10,000 on a four-month pilot and then $50,000 for a full year after the pilot is over.


When Open Raleigh launches in a beta version Friday, residents will have access to fire, police, census and building permit data as well as some financial data. More data will continue to be added as the public requests it.


The data will be in a readable and downloadable format so it can be manipulated or visualized in a number of means. For example, neighborhood leaders can create crime maps for their communities, or mobile application developers can create an app that tells users where to find the nearest greenway.


A full launch will be done in late September and will include a full financial ledger.


Eventually, Open Raleigh will be compatible with other regional municipalities and include data from county, state and the federal government.


City IT staff and members of the Technology and Communications Committee this week discussed ways the City could measure the return on investment and track how the data is being used, but more work will need to be done before that is possible.

Friday, September 21, 2012

Find: Build apps for elections with the Google Civic Information API

Google Code Blog Build apps for elections with the Google Civic Information API

Author Photo
By Chetan Sabnis, Google Politics & Elections Team

Cross-posted from the Google Politics & Elections Blog

Google’s mission is to organize the world’s information and make it universally accessible and useful. To make it easier for you to build apps with voting information on the web, we are releasing our new Google Civic Information API. The API enables you to look up comprehensive voting information for an individual U.S. address, including polling place, early vote sites, contests, and local election official contact information. By releasing this API, we hope to unleash the creativity of the Internet and help you build innovative products that push civic information to your communities in interesting ways.

As you know, this type of information can change frequently as we get closer to Election Day, and we will make every effort to ensure we're returning timely and accurate data. We have also included contact information for local election officials in the API so voters can find the most accurate information.

#more 

While this API only includes voting information for elections in the U.S., we plan to expand to other countries and include other types of civic information. Please join the Google Civic Information API Forum for updates on the data available and check out the Google Politics & Elections page to find more information about the work we are doing around the election and our international elections programs.


You can get started here through the Google APIs Explorer. The API is available now, but please note that full information isn't yet available for the November 6th General Election. We expect to be able to provide full live data around the middle of October, as it becomes available. For now, we recommend building your applications using the test data we provide. We'll be using the API to power our own election tools over the coming weeks, including an embeddable app anyone can use on their site, and we're looking forward to seeing the applications you come up with!

The Civic Information API replaces our previous Google Election Center API, which will be turned down after January 1, 2013.

For questions, comments, and to showcase your apps using the API, we encourage you to use the Google Civic Information API Forum.


Chetan Sabnis is a software engineer on the Google Politics & Elections team. In his spare time, Chetan enjoys solving logic puzzles and crosswords.

Posted by Scott Knaster, Editor

Saturday, August 11, 2012

Find: Census Bureau releases 'America's Economy' app for Android

Good idea. 

Statistics on the go: Census Bureau releases 'America's Economy' app for Android

America's Economy App

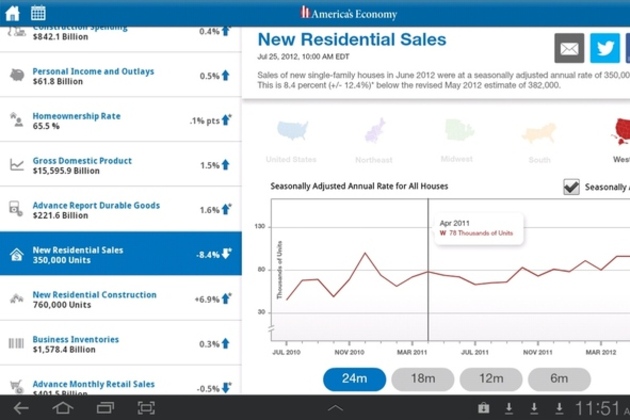
The US Census Bureau just released its public API last month, and now the agency has released the America's Economy app for Android phones and tablets with an iOS version in the works. By combining its own data with that of the Bureau of Economic Analysis and the Bureau of Labor Statistics, the Census Bureau's app will track real-time trends in "employment, housing construction, international trade, personal income, retail sales and manufacturing." The app was created as part of the Census Bureau's Web Transformation Project to help federal employees and the general public access accurate data about the US' socioeconomic health. Both tablet and phone versions of the app are available in the Google Play store now.

Monday, August 6, 2012

Data: Reese News launching Roll Call

Reese News launching Roll Call

UNC's online news service is launching a new tool to help reporters, wonks and voters keep track of legislation.

Competition: Google Places API Developer Challenge 2012

Deadline 10/31

The power of places and big data for good: Google Places API Developer Challenge 2012

Author Picture
By Carlos Cuesta, Google Maps API Product Marketing Manager

Cross-posted with the Google Geo Developers Blog

How would you make your community or local government run better? In our first Google Places API Developer Challenge, we’re inviting developers around the world to make something that improves their communities or governments by using the Google Places API and its database of places and tools. The developers of the winning applications will receive a VIP experience at Google I/O 2013.

You might create an app or site that solves health problems, understands crime patterns, or improves commerce. You can use any platform as long as you build with the Google Places API and it benefits your community or government. We’re looking for your best and most innovative ideas.


Built on the comprehensive global database of more than 95 million places that powers Google Maps, the Google Places API enables you to search for information about a variety of nearby places such as establishments, geographic locations and prominent points of interest. You can re-rank place results based on user check-ins, and create new places specific to your app.

To help you develop your ideas and build better apps, we’ve been working with local government officials in Austin, Boston, Chicago, London, Louisville, New York City, Philadelphia, Portland, San Francisco, and Seattle along with the White House to surface a wide variety of data sets for your apps. You can find these data sets and more on the Google Places API Challenge site at http://developers.google.com/challenge and hear more about what cities have to say about the challenge here. You can also follow updates and hangouts about the challenge on +Google Maps API.

The submission window opens on August 15th and closes on October 31st, 2012.

We look forward to seeing what can happen when your imagination and the Google Places API come together!

Tuesday, July 31, 2012

Data: Introducing the Multi-Channel Funnels Reporting API

Introducing the Multi-Channel Funnels Reporting API

Author Photo
By John Huang, Software Engineer


Cross-posted from the Google Analytics Blog

Measuring how marketing efforts influence conversions can be difficult, especially when your customers interact with multiple marketing channels over time before converting. Last fall, we launched Multi-Channel Funnels in Google Analytics, a new set of reports that help shed light on the full path users follow to conversion, rather than just the last click. One request we’ve had since the beginning was to make this data available via an API to allow developers to extend and automate use cases with the data. So today we’re releasing the new Google Analytics Multi-Channel Funnels Reporting API.

The API allows you to query for metrics like Assisted Conversions, First Interactions Conversions, and Last Interaction conversions, as well as Top Paths, Path Length and Time Lag, to incorporate conversion path data into your applications. Key use cases we’ve seen so far involve combining this conversion path data with other data sources, such as cost data, creating new visualizations, as well as using this data to automate processes such as bidding.

For example, Cardinal Path used the new Multi-Channel Funnels API, Analytics Canvas ETL (Extract, Transform, Load) and Tableau Software to help their client, C3 Presents, uncover how time and channels affected Lollapalooza ticket sales in an analysis dubbed “MCF DNA.” The outcome was a new visualization, similar to a DNA graph, that helped shed light on how channels appeared throughout the conversion funnel.


Monday, July 30, 2012

Data: US Census Bureau releases public API for mobile and web developers

Cool. More please. 

US Census Bureau releases public API for mobile and web developers

us census api

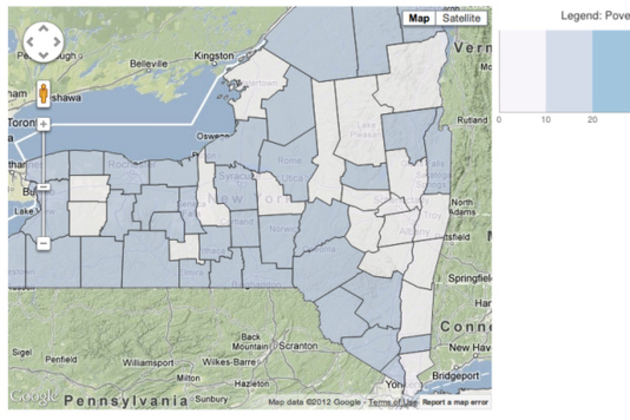
The US Census Bureau has released its very first public API, allowing developers to create web and mobile apps based on the government's collection of demographic and economic statistics. The Bureau launched the API Thursday, alongside a new "app gallery" website where users can view and download apps that have already been built.

With the API, developers will have access to two sets of statistical databases: the 2010 Census, and the 2006-2010 American Community Survey. The former includes the latest data on population, age, sex, race, and home ownership, while the latter offers more socio-economic statistics, covering fields like education, income, and employment.

The Census Bureau is encouraging developers to create apps that are...

Tuesday, June 19, 2012

Viz: The changing hue of movie posters

Looks like a nice dataset. 

The changing hue of movie posters

movie poster colors

A couple of weeks ago, software engineer Vijay Pandurangan had a theory. He decided that movie posters have, over the years, become more dark and more blue. Rather than moving on with his life, he decided to analyze the color data from 35,000 posters produced from 1914 to present day. The result, which you see above, shows that his theory was correct.

At the top of the image you'll see data from 1914 and at the bottom that from present day. Pandurangan also produced an interactive version that gives detailed statistics for each year, as well as a clearer graphic that doesn't take image brightness into account. You can find both, along with an explanation of his process for creating the visualizations, on his blog.

Thursday, June 14, 2012

Find: designing data

Art Swanson (@art_swanson)

6/13/12 7:01 PM

Designing data zite.to/LSjKPb via @Zite

Wednesday, May 30, 2012

Find: US government to make data available through apis

Soon please. 

Open government reboot focuses on APIs instead of data


Issued by the Office of Management and Budget, the Digital Government Strategy is the basis of a new White House directive to expose "high-value" Federal data through Web APIs


Have you ever wanted a mobile app that ties your location to crime statistics, government environmental and health data, and weather and solar flare data to calculate the hourly probability of a zombie apocalypse?  While that may not be exactly what the White House has in mind, it’s the sort of mobile mash-up that a new Federal IT policy could make a lot less difficult to create. The Obama administration has added another twist on “open government”—open, as in open API.


On May 23, the White House issued a directive that requires all agencies to establish programming interfaces for internal and external developers to use, and make “applicable Government information open and machine-readable by default.” As part of an effort to push government toward a cloud-computing future, the White House is encouraging agencies to make their data more developer friendly, and to create a shared platform for providing mobile access to data for both citizens and government employees. And they have 12 months to start delivering.


The goal of the new policy, called the Digital Government Strategy, is to jump start the government’s three-year old open data initiative, draw more private developer interest, and encourage the development of mobile applications that connect citizens and government employees more effectively with data that has previously been public, but nearly inaccessible.

Thursday, May 17, 2012

Find: Google data shows smartphone growth is global

Google
Last October, we launched Our Mobile Planet, a resource enabling anyone to visualize the ways smartphones are transforming how people connect with information, each other and the places around them.

Today, we're releasing new 2012 research data, and the findings are clear—smartphone adoption has gone global. Today, Australia, U.K., Sweden, Norway, Saudi Arabia and UAE each have more than 50 percent of their population on smartphones. An additional seven countries—U.S., New Zealand, Denmark, Ireland, Netherlands, Spain and Switzerland—now have greater than 40 percent smartphone penetration. In the U.S., 80 percent of smartphone owners say they don’t leave home without their device—and one in three would even give up their TV before their mobile devices!


We conducted this research to help people to better understand how mobile is changing our world. You can learn about mobile-specific usage trends, use this tool to create custom visualizations of data and more. There's plenty to discover in the latest research—to dig into new survey data about smartphone consumers in 26 countries from around the world, read our post on the Google Mobile Ads blog or visit http://thinkwithgoogle.com/mobileplanet.

Posted by Dai Pham, Group Product Marketing Manager, Google Mobile Ads

Saturday, April 21, 2012

Data: NASA Tournament Lab holds a contest for programmers who can improve access to its data archives

100tb of data! The NASA tournament lab sounds interesting. 

Ars Technica

NASA is using its NASA Tournament Lab on TopCoder to attack its galactic-scale pile of remote mission data. Over the years, NASA has accumulated over 100 terabytes of data from space missions, and the sheer size of the archive makes it difficult to manage the data and make it available.

Anyone can look at the archive at NASA's Planetary Data System website. What NASA would like someone to do is not only make that data more accessible for scientists, but also package it up for non-scientists to access and manipulate. The agency hopes that school children, teachers and parents, game designers, or almost anyone will hit up the database and find more uses for it than solely science. In a practical sense, the more people accessing the database, the better a case NASA can make for its worth to American society.

The prize is up to $10,000 (and the coveted crown for Space Coder of the Galaxy 2012) for "coders, mathematicians and creative thinkers" to brainstorm new ideas for NASA's planetary science data. You can find more details over at NASA's PDS Challenge home page.

Wednesday, April 18, 2012

Data: City to Allocate $50,000 for Open-Source Data

Raleigh Public Record

Raleigh is talking the talk and walking the open-source walk. In a 6-to-2 vote, city councilors agreed Tuesday to provide $50,000 annually for an open-source data catalog.

The funding will be included in next year’s budget, which will be presented by City Manager Russell Allen next month. Councilor and Technology and Communication Committee Chair Bonner Gaylord, who originally proposed the idea, said the catalog is a necessary step for a more open and transparent government.

City data will be digitally published and made ready for use by city residents, software developers or news outlets. Data can be viewed in a raw form or downloaded so that it could be turned into graphic visualizations, such as maps or graphs. Data could also be embedded into software, like smart phone applications.

On the city’s end, publishing data online could defer public records requests managed by staff.

Allen said his main concern is the ongoing cost of the project, which until Tuesday was not included in budget calculations. He added that there are also issues with ongoing staff costs. There is no intention to hire additional Information Technology staff, which means uploading and maintaining the data will add more responsibilities to current employees.

He said his only argument is the timing of the request; he suggested councilors wait until they have seen the budget and include it in their budget discussions.

Councilor Eugene Weeks agreed that it shouldn’t be included in the budget but discussed as a budget note.

Gaylord said that if the city wishes to move forward with being called an open-source city, then councilors must consider this request as a budget priority.

Councilors Weeks and Thomas Crowder voted against the motion to make the open-data initiative a budget priority.

“I think we should set our priorities first and then manipulate what we feel are our priorities rather than allowing other priorities to supersede those and then we get to fight it out amongst ourselves during the budget session,” Gaylord said.

Crowder said if the city wants to be truly transparent, then the entire budget should be looked at line by line. Crowder said he doesn’t mind discussing this as an item or if it’s included in the budget, “as long as everything is open to scrutiny and review.”

Normally fiscally conservative Councilor John Odom supported the initiative, saying that if the city is going to be a global market then this is a step in that direction.

Odom, Crowder and Mary-Ann Baldwin, expressed some concerns that the move toward open government is happening in pieces rather than seeing a whole plan in place.

Chief Information Officer Gail Roper said her staff has a preliminary timeline of about two to three months for data to be released. But one of the main priorities would be hearing from the public as to what data the community wants readily available.Similar Posts:

Sent with Reeder

Saturday, April 7, 2012

Data: CPU DB: Recording Microprocessor History

Go all nerdy about nerdy stuff. Visualize cpus. 

ACM Queue
With this open database, you can mine microprocessor trends over the past 40 years.

Wednesday, April 4, 2012

Data: 1940 US Census becoming fully searchable online through volunteer effort

The Verge - All Posts
1940 census | Wikipedia public domain

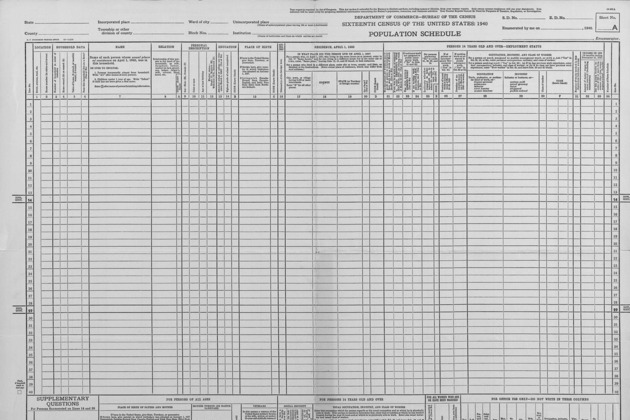
Today the National Archives and Records Administration (NARA) released images of the 1940 Census, and a project is already underway to ensure that the information becomes easily available to anyone who wants to know a bit more about the Great Depression. The NARA has teamed up with leading genealogy groups like Archives.com and FamilySearch.org to create what's being described as a "high quality, searchable database" of the more than one million pages contained in the Census. You can already browse through the Census images, but the process is cumbersome — for instance, you can't search by a person's name, but instead can only browse by location or enumeration district.

But with a team of online volunteers, the 1940 US Census Community...

Saturday, March 31, 2012

Data: Raleigh Taking Steps to Publish Open Source Data

Raleigh Public Record

Later this year, Raleigh residents could have access to city information and data in an accessible and usable format.

As part of its plan to become an “open-source” city, staff presented information Tuesday to the Council’s Technology Committee about plans to publish more data on the city’s website.

The first step will be to create a website where the information can live. The site will link from the city’s website and provide a “one-stop shop for how the public can engage in conversation,” according to Chief Technology Officer Jonathan Minter. He said that step will be complete in April.

City staff will then create an open data and open source policy, Minter said, to guide language in future requests for proposals and how the city will “put data out there so it can be used by constituents.”

Other cities already have such policies, from which staff can draw elements. Minter said City Camp and other similar groups will also provide a forum for policy ideas.

“The vision here is these aren’t going to be policies we as staff do and push out,” he said. “We want to have collaborative partnerships with folks.”

Those groups and other residents can also help prioritize what data is published on the site, he said. The goal is to prioritize data sets by June.

“There’s literally thousands … to choose from,” he said. “[We can ask] department heads. They know what they get public records requests for.”

Finally, the city will publish the data. Minter said the goal is to publish by September. Staff is considering several solutions for hosting the data, which Minter estimates will cost up to $50,000 per year.

Minter said that figure is at the “high end of the spectrum.”

He demonstrated one possible platform, called Socrata, used by the federal government, along with city governments such as Austin and Chicago. The platform not only hosts the information, but lists it in multiple ways. It enables users to see the data, export it in a variety of formats, create charts, graphs and maps and even has an interface for developers who want to create apps.


#more 

Members of the technology committee questioned the use of this data by the city’s less technology-savvy residents.

“You don’t have to be a developer to interact with the data,” Minter said, showing some of the charts. “A typical user with some level of computer proficiency should be able to brose the data and look for things of interest to them.”

Councilor Mary-Ann Baldwin asked about other, non-technological, ways to make the city open source.

“In talking about open source … one of the things we know is that a number of our citizens do not have access to Internet,” she said. “When I look at this open source thing, it’s only focused online. What about others? How do we engage them in this process as well? I hate to use this term, but it’s almost like ‘analog’ open source.”

City Public Affairs Director Jayne Kirkpatrick said that outreach continues.

“Everything that we do today to reach any of the residents, I like to make sure we use every resource we have,” she said, naming off such “old fashioned” methods as Citizens Advisory Councils. “This should not be any different in anything else we do.”

Councilor Bonner Gaylord said it’s about adding access.

“This is not about removing access the analog; way. It’s about adding access,” he said. “It’s just adding to what’s already there.”

The steps are already in motion, and required no approval from the committee. The final publishing step will require approval for the software. Councilors agreed to recommend the cost be considered as part of the next fiscal year’s budget. The next fiscal year begins July 1.Similar Posts:

Sent with Reeder

Monday, February 27, 2012

Data: Campaign Finance Data in Real Time

NYT > Open
Political campaigns can change every day. The Campaign Finance API now does a better job of keeping pace.
Sent with Reeder

Saturday, January 21, 2012

Find: @seismologists collect #data, 140 characters at a time

Twitter and phones collect quake data. 

Ars Technica

On August 23, 2011, a magnitude 5.8 earthquake centered 40 miles northwest of Richmond, Virginia had the East Coast abuzz. As you’d expect, social media lit up as people reported the experience. You can actually see the travel of the seismic waves if you map out the tweets containing the word "earthquake." While that’s no match for the beautiful data recorded by the EarthScope seismic network, some researchers see the beginnings of a data revolution.

Count Richard Allen, a seismologist at the University of California-Berkeley, among those who want to ride the wave. In a perspective article published in Science, he argues that crowdsourced earthquake data is a potential gold mine.

Wednesday, January 18, 2012

Data: Vehicles involved in fatal crashes

FlowingData
Vehicles involved in fatal crashes
After seeing this map on The Guardian, I was curious about what other data was available from the National Highway Traffic Safety Administration. It turns out there's a lot and it's relatively easy to access via FTP. What's most surprising is that it's detailed and fairly complete, with columns for weather, number of people involved, date and time of accidents, and a lot more.
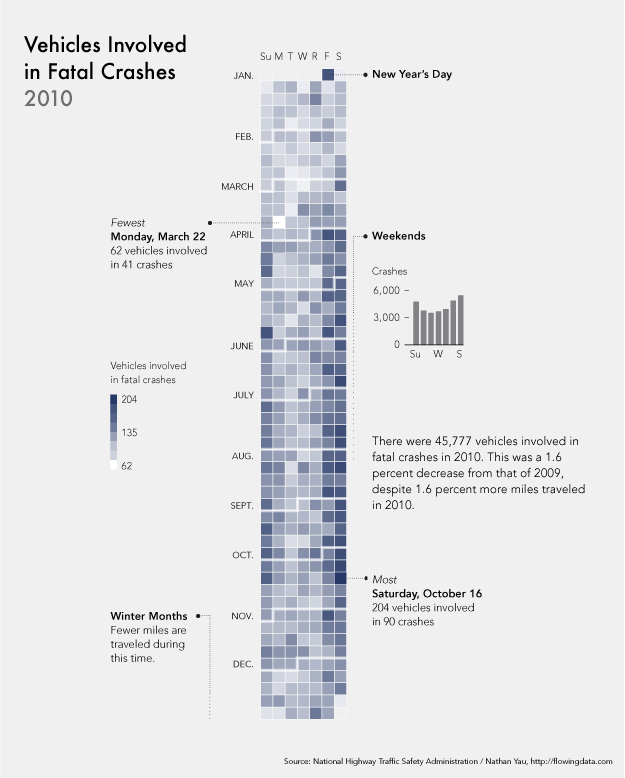
The above shows vehicles involved in fatal crashes in 2010 (which is different from number of crashes or number of fatalities). This data was just released last month, at the end of 2011 oddly enough. It's a calendar view with months stacked on top of one another and darker days indicate more vehicles involved.
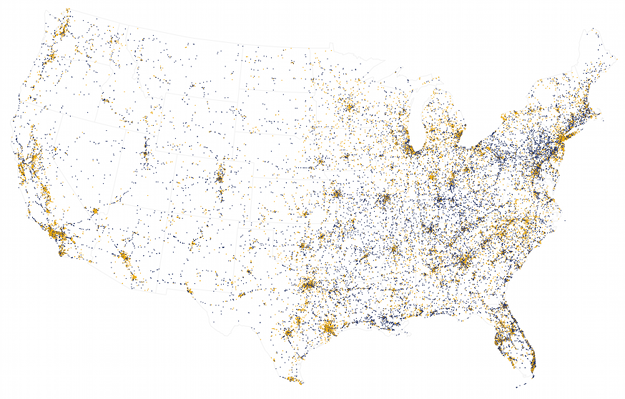
Nearly every single data point also has location attached to it, so I tried some mapping, but they look like population density more or less. Here's one that shows crashes that occurred on local roads (orange) and those on freeways, highways, etc (blue). Road patterns start to come out for the major interstates.