FlowingData

After seeing this map on The Guardian, I was curious about what other data was available from the National Highway Traffic Safety Administration. It turns out there's a lot and it's relatively easy to access via FTP. What's most surprising is that it's detailed and fairly complete, with columns for weather, number of people involved, date and time of accidents, and a lot more.
The above shows vehicles involved in fatal crashes in 2010 (which is different from number of crashes or number of fatalities). This data was just released last month, at the end of 2011 oddly enough. It's a calendar view with months stacked on top of one another and darker days indicate more vehicles involved.
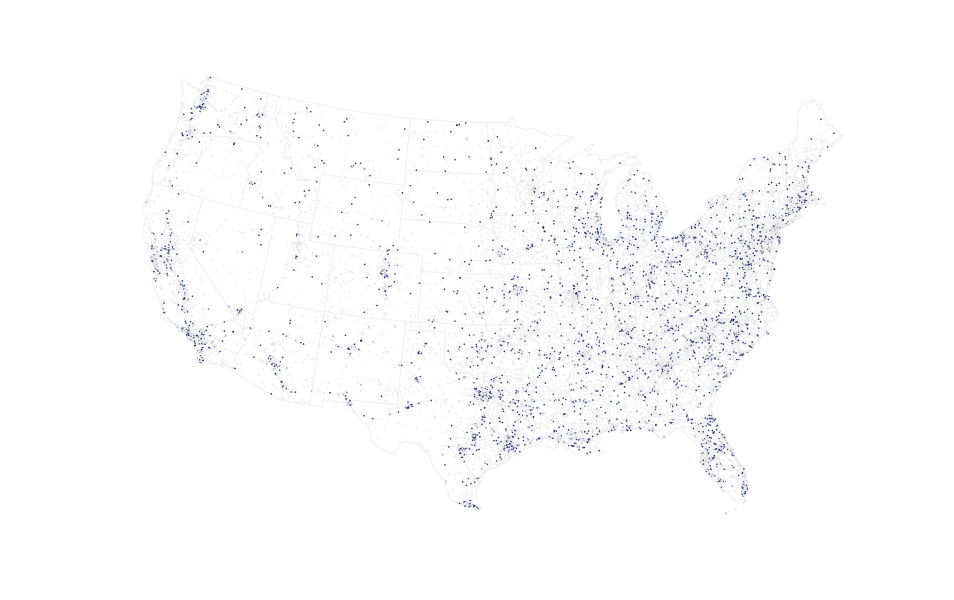
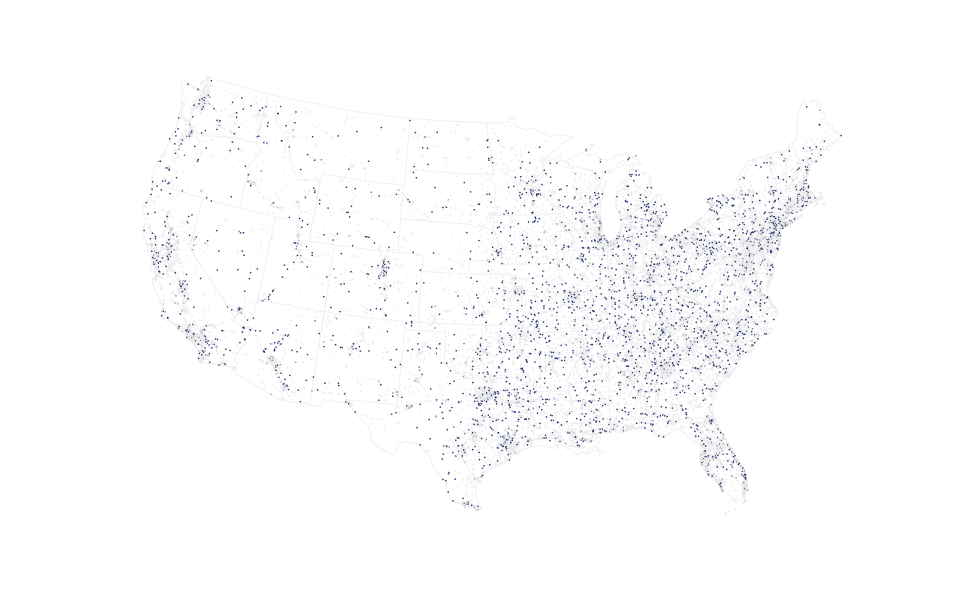
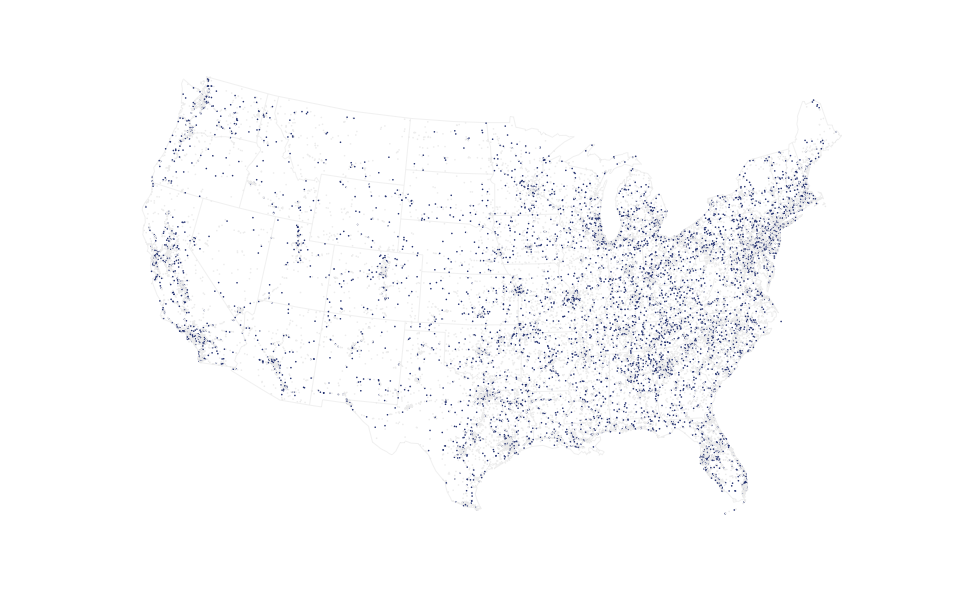
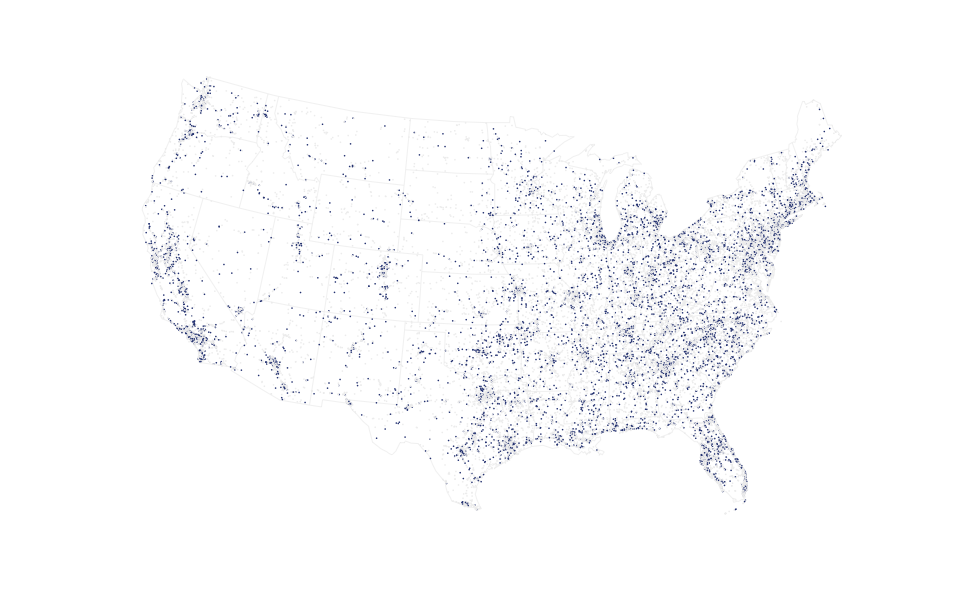
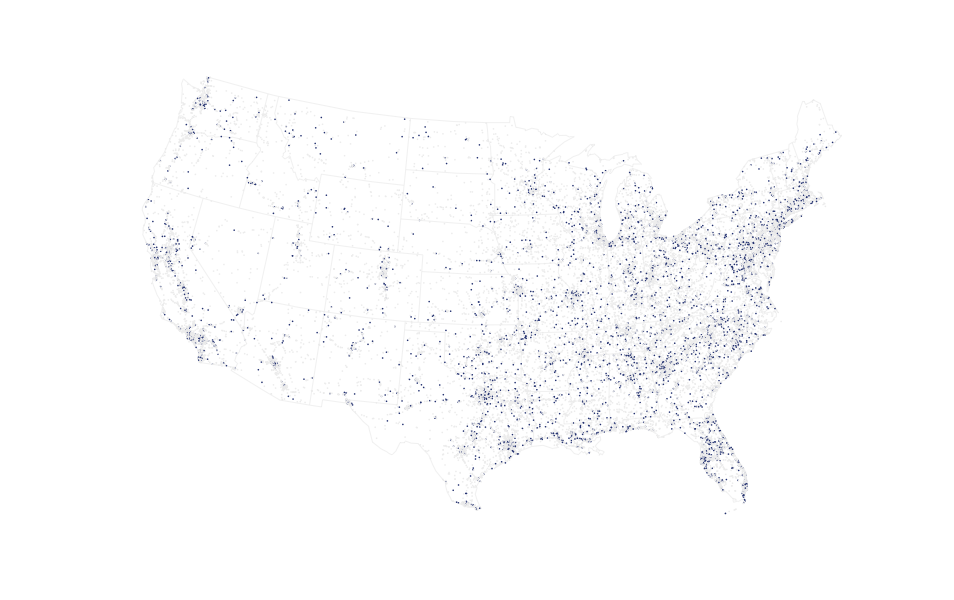
Nearly every single data point also has location attached to it, so I tried some mapping, but they look like population density more or less. Here's one that shows crashes that occurred on local roads (orange) and those on freeways, highways, etc (blue). Road patterns start to come out for the major interstates.

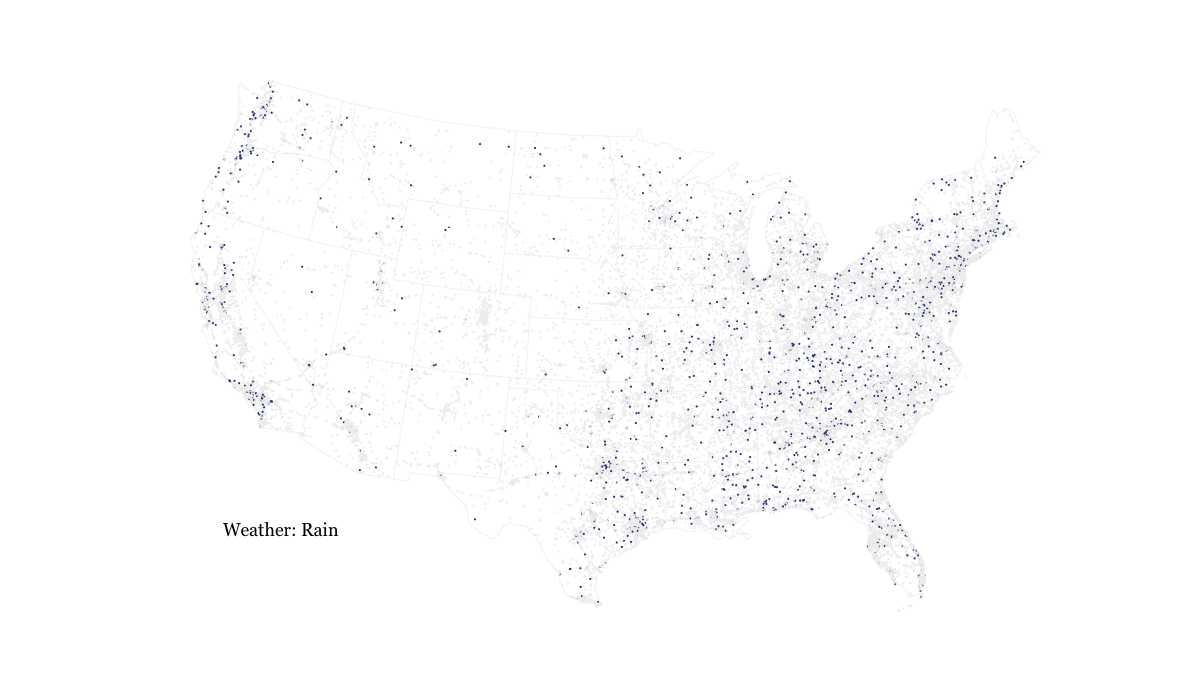
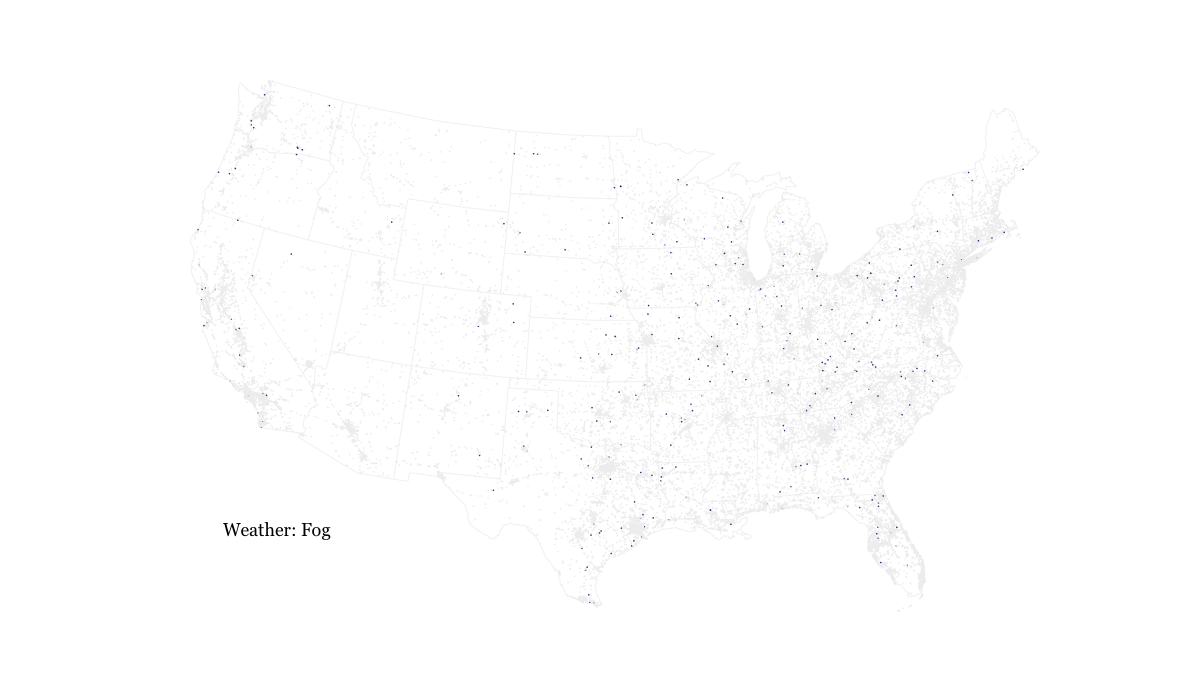
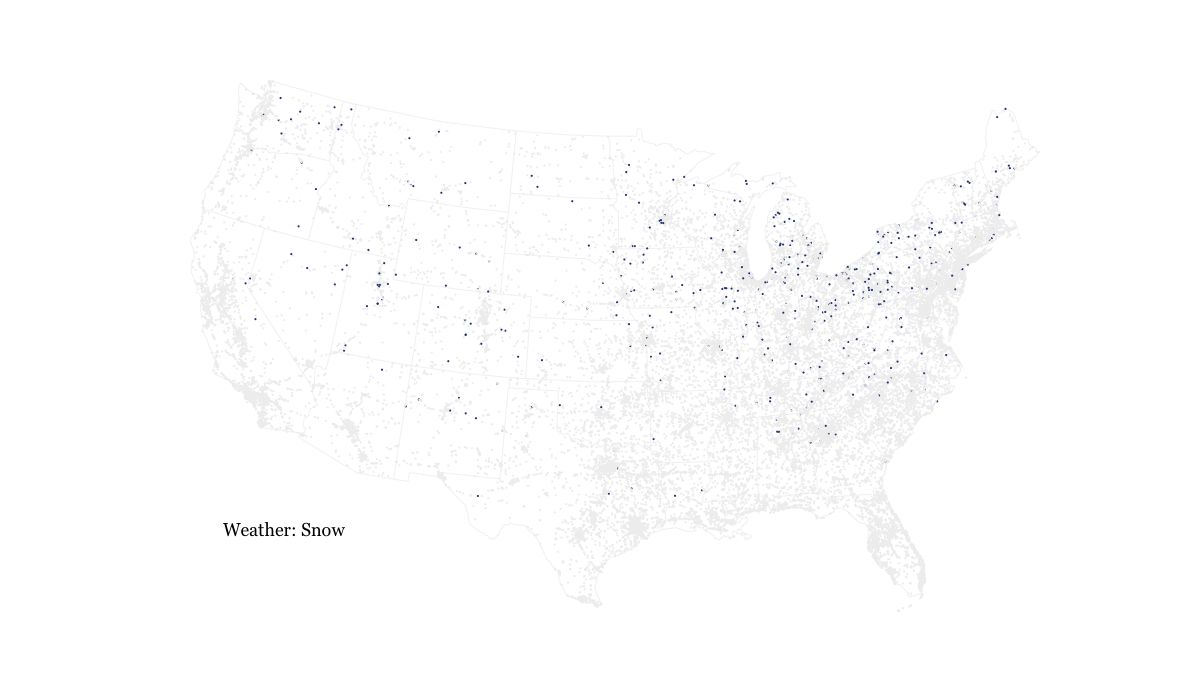
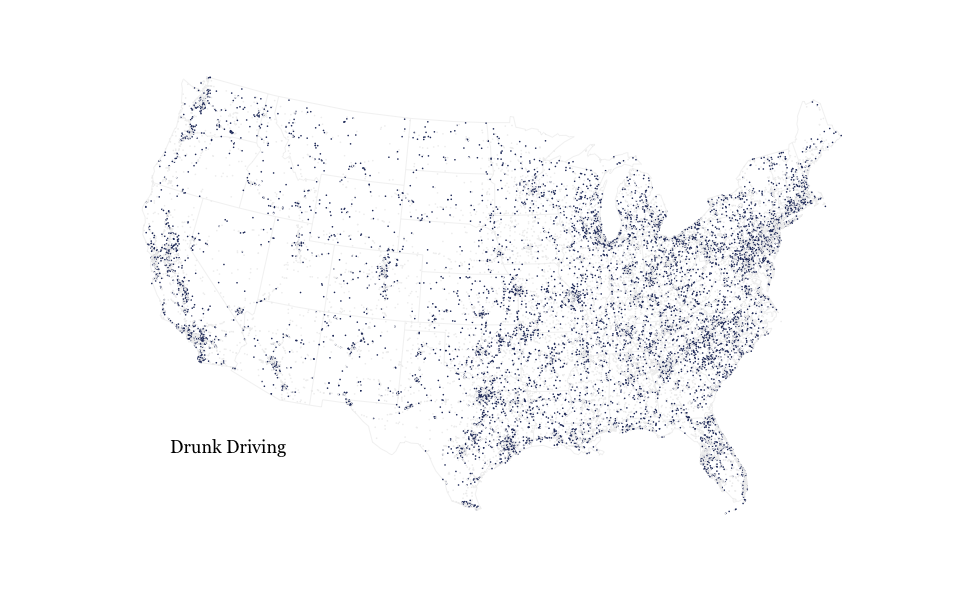
I also mapped by weather (rain, fog, snow), time of day (midnight to 4am, 4-8, 8-noon, noon to 4, 4 to 8, and 8 to midnight), and crashes due to drunk driving but it wasn't as interesting as the day-by-day.
If you're a teacher looking for data to use with an assignment or just want to practice, this is a good set, despite the somber topic. You can find the data here, and there's an FTP link in the footer of the page to download more detailed data. You'll also need this guide [pdf] that defines all the variables.
0 comments:
Post a Comment