Twitter is an organic online location, full of retweets, conversations, and link sharing. Jeff Clark tries to show these inner workings with his newest interactive, Spot. Enter a query in the field on the bottom left, and Spot retrieves the most recent 200 tweets. You then can choose among five views: group, words, timeline, users, and source.
Each tweet is represented by the tweeter's profile picture, and they rearrange themselves as you switch between views. The latter three views, timeline, users, and source, arrange tweets into bar charts. Fairly straightforward.
Spot gets interesting with the first two views though, groups and words. Tweets are arranged based on the words they use.
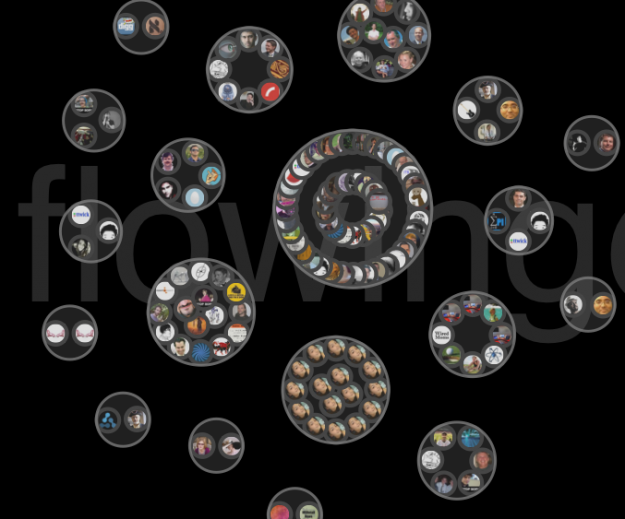
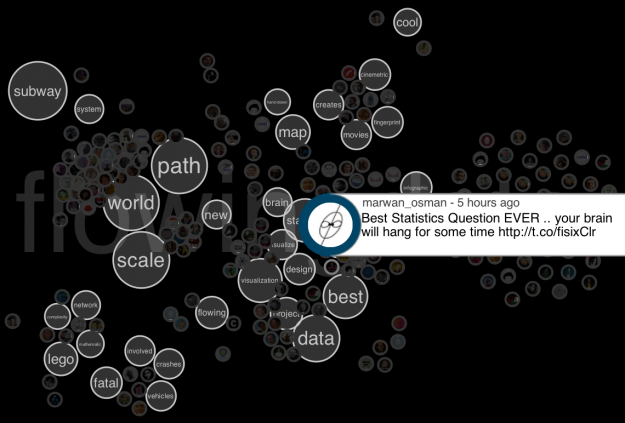
Above, for example, is the word view on the search "flowingdata." Tweets cluster around words like world and data. Below is the same search, but with the groups view. Users who tweeted similar text (usually retweets) are grouped together. What jumped out at me was the group on the bottom with a single user's face. That turned out to be a spammer.

Give it a try for yourself here.

0 comments:
Post a Comment