Why Should Engineers and Scientists Be Worried About Color?

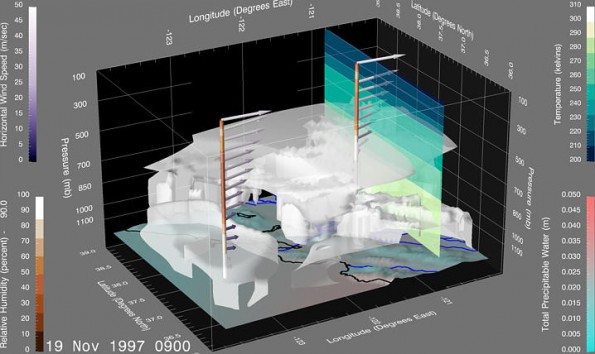
IBM Research has a paper online from Bernice Rogowitz and Lloyd Treinish investigating the many strategies of colormaps used in data visualization, in hopes of creating a more stringent rule-based approach that can more intelligently apply default structures. Included are many example visualizations like the one above.
Some of these ideas can be applied to more complex applications with multiple data sets in three dimensions, as illustrated in Figure 9. These data are from an analysis of various weather observations, which indicate the state of the atmosphere on November 19, 1997 at 01:00 local time in the San Jose area. Four distinct colormaps (two isomorphic and two segmented) are used to visualize four different variables using a variety of geometries registered into a single geographic scene. The choice of colormaps used for each of these variables and their realizations is based upon their spatial characteristics and the task associated with the visualization. For example, relatively noisy data such as wind speed are primarily mapped into luminance, while relatively smoothly varying data such as temperature are primarily mapped into opposing saturation pairs to impart a continuous representation. When contouring is selected as a technique, the data are mapped into a set of bands, to which a segmented colormap with perceived ordinality is applied.
via Why Should Engineers and Scientists Be Worried About Color?.
Reach out to the community of Visualization and Graphics Experts by Advertising on VizWorld.com
Related posts:
0 comments:
Post a Comment